Inspection Tool
Use this tool to analyze dependencies among cameras in a scene.
Inspection is robust when verifying where to add images and what are the good and weak points of a scene. It might help you to find more optimal configurations for your cameras and so on. In other words, use this tool to analyze dependencies among cameras in a scene.
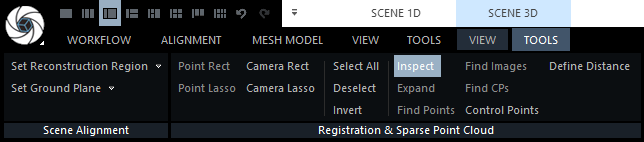
Where to find the Inspect tool: SCENE 3D/TOOLS tab - in the part Registration & Sparse Point Cloud. You can also simply press the letter I key while working in the 3Ds scene view.
There are three methods of inspection that you can use:
- Camera relations Use this option to check the relations between the cameras.
- Point cloud uncertainty Use this to analyze the precision of tie points' location and the uncertainty of the calculated positions.
- Misalignment detection This option should give you a visual awareness if you have any misalignment in your project and help you troubleshoot them.
Camera relations
When using this approach, cameras are connected into virtual components based on their mutual connections and the defined settings. The cameras in the same virtual components are marked with the same color. If there are several virtual (color) components created, then the connection among the cameras from these separate components could be more stable, and we recommend adding images in these areas.
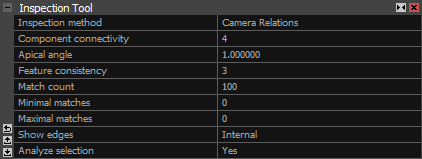
- Component connectivity Minimal connections with neighboring cameras/images. If there is at least this number of edges among cameras, then those cameras are connected into one component (cameras marked with the same color). The edges among the cameras are created based on the following settings.
- Apical angle Minimal apical angle among neighboring cameras/images. It is an angle created by two projection lines (from two cameras), and the tie point is a vertex of the angle. The smaller the number, the better.
- Feature consistency This stands for the minimal consistency of a feature and defines the number of cameras that need to 'see' that feature. If the feature is visible in this number of cameras/images and if the angle among the pairs of cameras is bigger than the angle defined by the Apical angle, the Matches count for the edge is raised by one.
- Match count Here, you can specify the desired overall number of connections among images. Two cameras are connected into one virtual component only if there is at least this number of common features (matches) among those two cameras. Matches are features that meet the conditions defined by Apical angle and Feature consistency.
- Minimal matches Here you can specify the desired smallest number of connections between two images. Edges with the number of features lower than this value are not displayed at all. Edges with this number of features are displayed in a dark blue color.
- Maximal matches Use this to specify the desired greatest number of connections between two images. Type 0 for no such limit. The edge with the highest number of features is displayed in a dark red color. If you set the specific value, then it is the greatest number of connections between two images. The color scale is recomputed according to the minimal and maximal matches.
- Show edges Type of edges to be shown: internal/external/both. Internal edges are edges inside the virtual components. External edges are edges outside the virtual components, the ones connecting individual virtual components. If you use both, you can see all the created edges (grey ones are internal, colored ones are external).
- Analyze selection Set this one to True when you want to restrict the connectivity analysis to a camera/cloud selection.
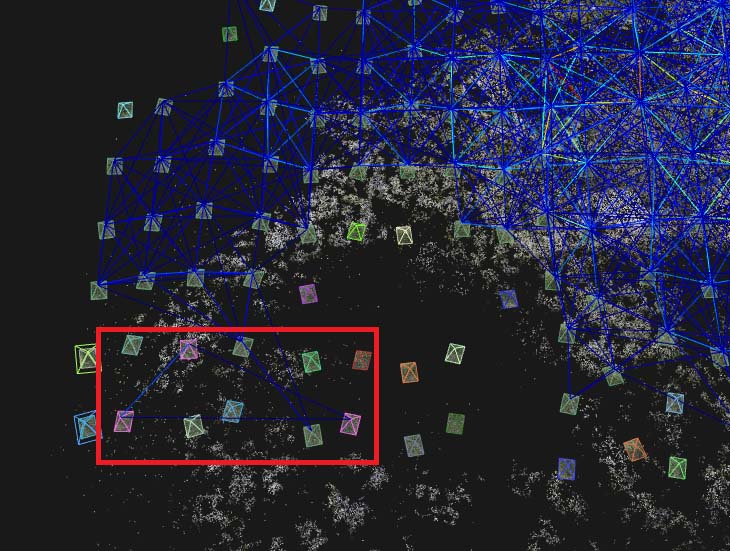
In the picture below, you can see a majority of cameras connected to one virtual component, three pink cameras connected to the second virtual component (in the red box), and separate cameras marked with different colors, not connected to any component. In such disconnected areas, it is recommended to add more images in order to make the connections more stable.
The color scale for the edges (connections among cameras) is as follows:

Point cloud uncertainty
- Uncertainty enumeration method Defines a method used for calculating the uncertainty of tie points. This tool is applicable to points that are displayed w.r.t. to the chosen Track length in the 3D SCENE/VIEW context tab. Use the slider to restrict the points. You can choose between the Relative and Absolute methods.
-
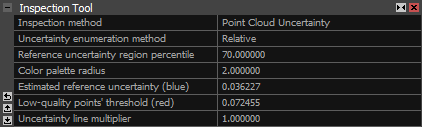
- Relative This method is suitable for non-georeferenced or non-scaled models where the precision (uncertainty) of points is displayed w.r.t. to the defined percentage of all points. The settings available with the relative method are:
-
- Reference uncertainty region percentile is a percentage value that defines the percentage of points that can be treated as correct. The default value is 70, which means that 70% of all tie points are considered stable and of good quality. These points are colored blue and are used as a reference for the evaluation of uncertainty for all other points. This value influences the color scale of all other tie points. The maximal uncertainty value from this percentage of points is used as an Estimated reference uncertainty (blue) number.
- Color palette radius is a multiplier that defines a range of points' uncertainty. Estimated reference uncertainty (blue) multiplied by this number gives the Low-quality points' threshold (red).
- Estimated reference uncertainty (blue) and Low-quality points' threshold (red) are the minimal and maximal uncertainty values that define the range of the color scale. All points with the uncertainty lower than Estimated reference uncertainty (blue) are colored dark blue (more precise points), and all points with uncertainty higher than the Low-quality points' threshold (red) are colored dark red (less precise points). Other points are colored w.r.t. to the color scale above.
NOTE: Points colored red represent areas where there is higher uncertainty of the calculated points. In these areas, you should add more images to calculate tie points with a higher precision. The direction of the red uncertainty lines represents a direction of the uncertainty. In such a case, add more images in the direction perpendicular to the uncertainty lines.- Absolute This method is suitable for georeferenced and scaled models in which you can define the uncertainty of points in the scene unit. The settings available with the absolute method are:
-
- Minimal uncertainty size (blue) defines the lower boundary of the color scale. All points with the uncertainty lower than this value are marked blue. E.g., for a coordinate system with a metric unit, a value 0.01 means 1 cm uncertainty in the location of tie points.
- Maximal uncertainty size (red) defines the upper boundary of the color scale. All points with the uncertainty higher than this value are marked red. All other points in between are colored w.r.t. to the color scale above.
- Uncertainty line multiplier A scale factor of the displayed uncertainty lines. The higher the value, the longer and more visible lines in the 3Ds view.
In the following picture, the areas with more red points are considered to have higher uncertainty and, therefore, lower precision. Add more images in such areas to improve the precision:
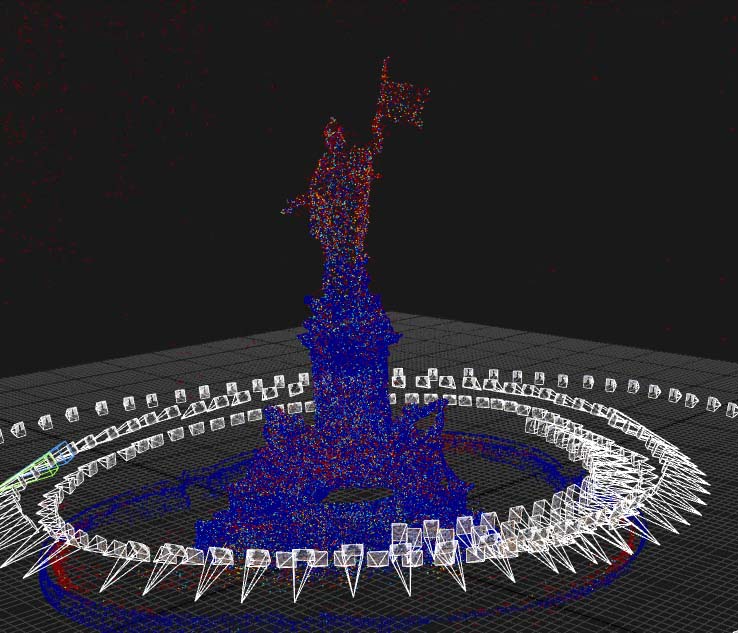 >
>
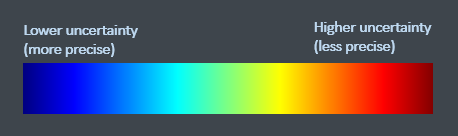
Uncertainty of points is displayed in this color scale:
Misalignment detection
This option enables you to find misaligned cameras or weak spots in your scene.
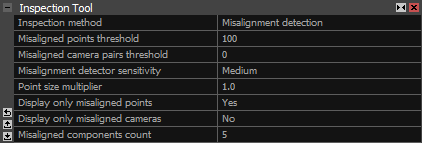
- Misaligned points threshold Marks with color the given percentage of points that are the most likely misaligned. If you choose, for example, a value of 50%, the misalignment tool will mark 50% of the most misaligned points.
- Misaligned camera pairs threshold Displays a given percentage of the most misaligned camera pairs for each misaligned camera group. If you choose, for example, a value of 50%, the misalignment tool will mark 50% of the most misaligned camera relations for each detected camera group.
- Misalignment detector sensitivity Sets the sensitivity of the misalignment detector. Higher sensitivity takes more computational time but will generate more data to work with. In some cases, the higher sensitivity can create false positives.
- Point size multiplier Use a higher value to enlarge the displayed points to make them more visible.
- Display only misaligned points Show only points treated as misaligned. Changing to Yes hides all correctly aligned points.
- Display only misaligned cameras Display only cameras treated as misaligned. Changing to Yes hides all correctly aligned cameras.
- Misaligned components count Filter the number of misaligned camera components that are displayed. Only this number of worst components will be shown.
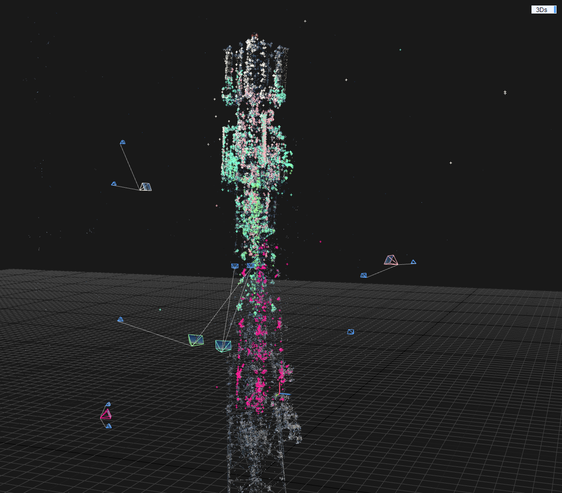
After the Misalignment detection was selected, the color of points in the 3Ds view will split into multiple colors. Blue colored points represent the correctly aligned points, while red points or points of a different color than blue are the ones RealityCapture calculated as misaligned.
Each set of points represents a "misaligned component", which cannot be seen in the 1Ds view, but is related to the Inspection tool. With this you can adjust the use of control points to correct the alignment and create a single component with higher accuracy.
Random colored cameras (misaligned cameras) are also going to be displayed in 3Ds view. These cameras should be larger than the cameras which represent the inputs. If you click on one of the misaligned cameras, cameras related to it will be selected. Their color represents their accuracy. Light blue cameras are the ones RealityCapture deems as the ones with lower accuracy, and grey cameras should have good accuracy. Cameras may be connected with white lines, which are usually heading toward the problematic camera.
See also:
- Merging Components click here
- Alignment Quality click here